An intelligent data analysis tool based on LLM and natural language interaction, featuring built-in data query and data visualization, as well as report generation capabilities.
data_analysis
Author: digitforce
Version: 1.0.9
Type: tool
Overview
This plugin enables codeless data analysis through natural language interaction. It supports Text2SQL, Text2Data, and Text2Code analysis. Simply upload Excel/CSV files to automatically execute data queries, data interpretation, and data visualization (ChatBI).
New support for multi-sheet queries and cross-sheet analysis, capable of automatically recognizing and parsing structured data in multiple worksheets, improving multi-sheet data processing capabilities.The plugin will intelligently parse time, metrics, and analytical dimensions through conversational queries , then generate SQL queries for data, and create interactive BI charts and structured analysis reports. Optimized for standardized vertical datasets, powered by enterprise-grade analytics engine for reliable results.
本插件通过自然语言交互实现零门槛数据分析。支持Text2SQL、Text2Data、 Text2Code分析,直接上传Excel/CSV 文件,自动完成数据查询、数据解读与数据可视化图表生成(ChatBI)。
新增支持多 Sheet 查询与跨 Sheet 分析,可自动识别并解析多张工作表中的结构化数据,提升多表数据处理能力。用户通过对话提问,插件将智能解析时间、指标、分析维度,生成SQL查询数据,并生成交互式BI图表和结构化分析报告。适配标准纵向数据表,内置企业级分析引擎确保结果精准可靠。
Configuration
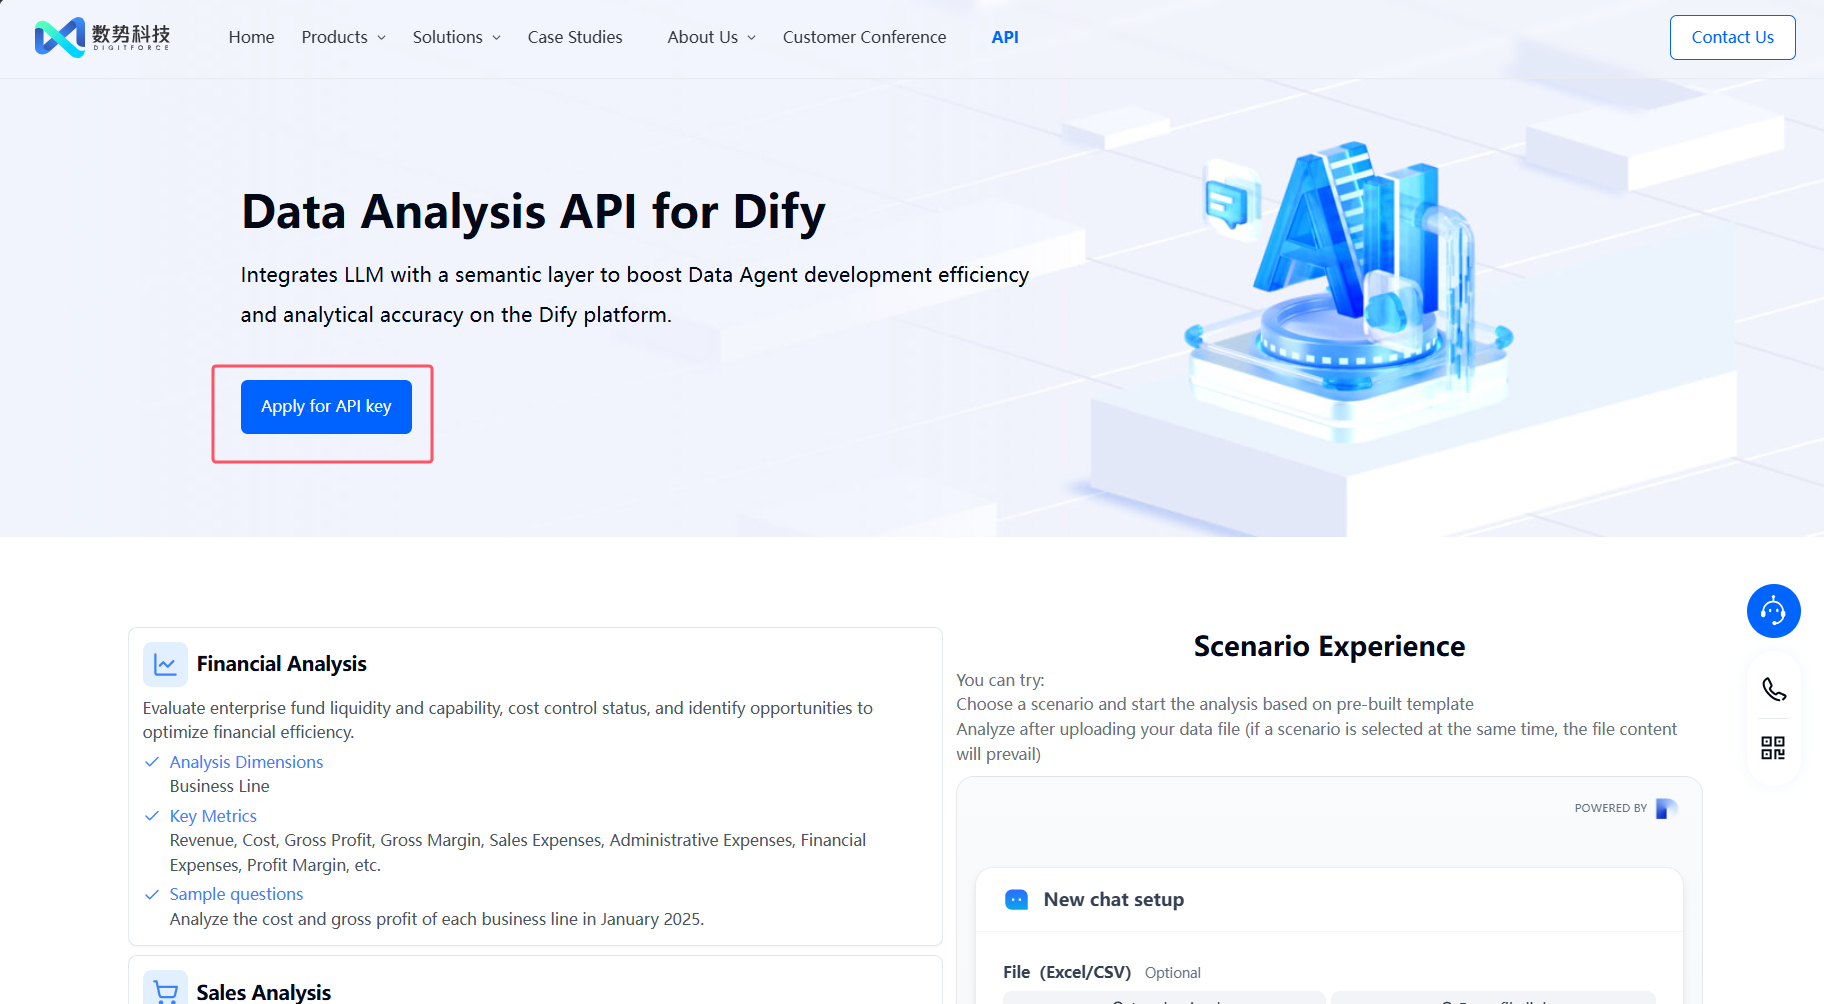
1. Apply for an API Key
Please apply for an API Key here.
请在这里申请API Key。
2. Get data analysis tools from the Marketplace
The tools could be found at the plugin Marketplace, please install it.
数据分析工具可在插件市场上查找到,请先安装。
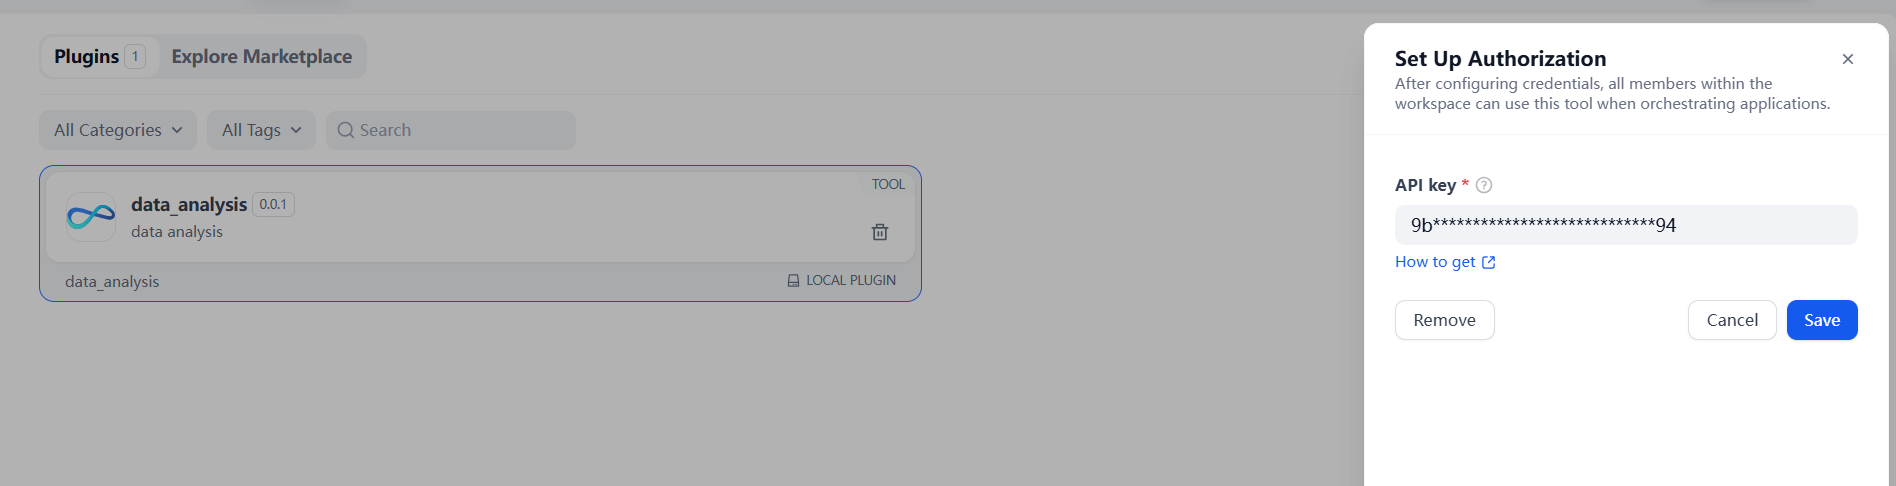
3. Service Authorization
-
Select [Plugins] - [data analysis] in Dify navigation page
-
Click the "To Authorize" button
-
Paste your unique API Key to complete verification
-
在Dify导航页点击【插件】-【数据分析】
-
点击「授权」按钮
-
粘贴您的专属API Key完成验证
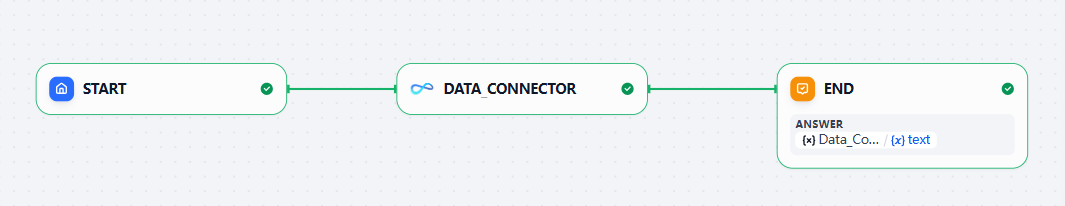
Workflow Cases
The following are the parameter descriptions and usage scenario examples of each tool.
以下是各个工具的参数说明及使用场景示例。
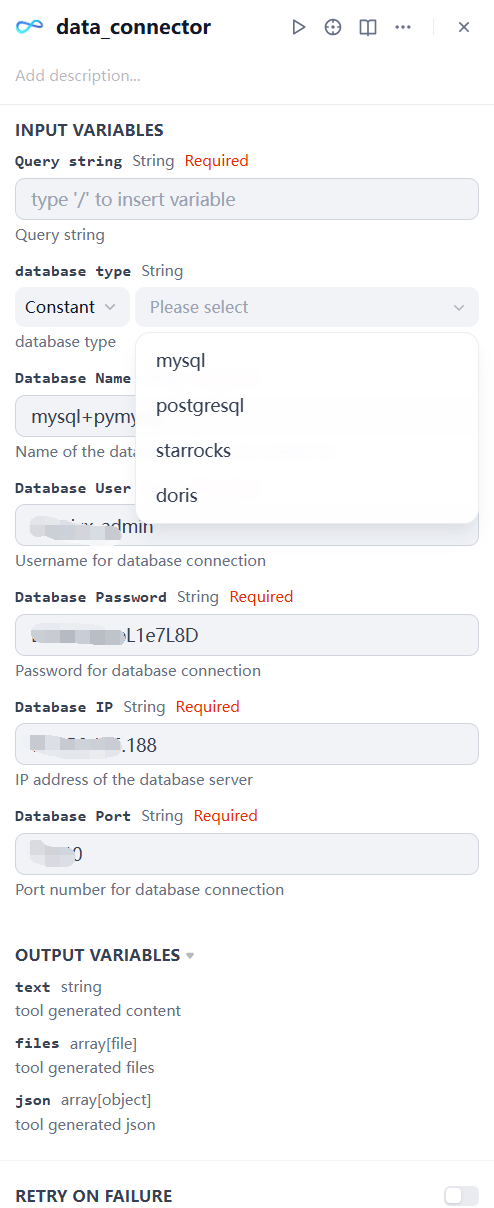
1. data_connector
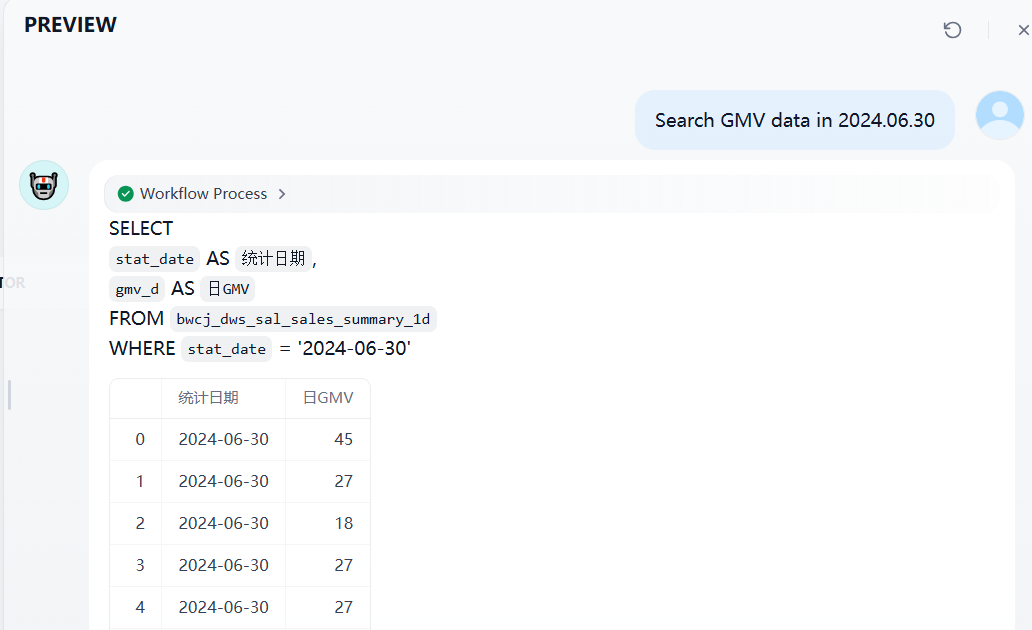
Used to connect mainstream databases such as MySQL, PostgreSQL, Starrocks and Doris, allowing users to query database data using natural language. Once data is retrieved, it can be seamlessly integrated with our other tools for analysis, interpretation, and visualization.
用于连接mysql、postgresql、starrocks、doris等主流数据库,通过自然语言查询数据库数据,获取数据后可结合我们的其它工具进行分析、解读、可视化。
The query results support downloading as an .xlsx file for easier local viewing and further processing.
查询结果支持下载为 .xlsx 文件,便于本地查看与二次处理。
💡 If you want the output to include files, please ensure to add the ' files ' output type in the last component of the flow to get the download link.
💡 如果想要输出结果包含文件,请确保在flow 的最后一个组件中添加“ files ”输出类型,以获取下载链接。
Note: For optimal browsing experience, results are limited to 100 rows by default. When working with large datasets, user may retrieve the full dataset by using the intelligently generated SQL query provided by the tool.
注意:为了浏览体验,默认展示最多100行数据。若数据量较大,需获取完整数据,可借助工具智能生成的SQL语句自行查询。
| Input Parameter | Description | Example |
|---|---|---|
| query | Query statement | query Query statement "Search GMV data in 2024.06.30" |
| database type | Select the corresponding type of database | As shown in the following figure |
| database name | Name of the database/schema to connect to | As shown in the following figure |
| database user | Username for database connection | As shown in the following figure |
| database password | Name of the database/schema to connect to | As shown in the following figure |
| database ip | IP address of the database server | As shown in the following figure |
| database port | Port number for database connection | As shown in the following figure |
Example input: For the database with url="mysql+pymysql://aaaadmin:[email protected]:11110/dify?charset=utf8", fill in the parameters as shown in the following figure.
示例输入:对于url="mysql+pymysql://aaaadmin:[email protected]:11110/dify?charset=utf8"的数据库,按下图填入参数
| Output Parameter | Description | Example |
|---|---|---|
| query results | Output of data_connector(Including SQL statements and returned query results in markdown format.) | As shown in the following figure |
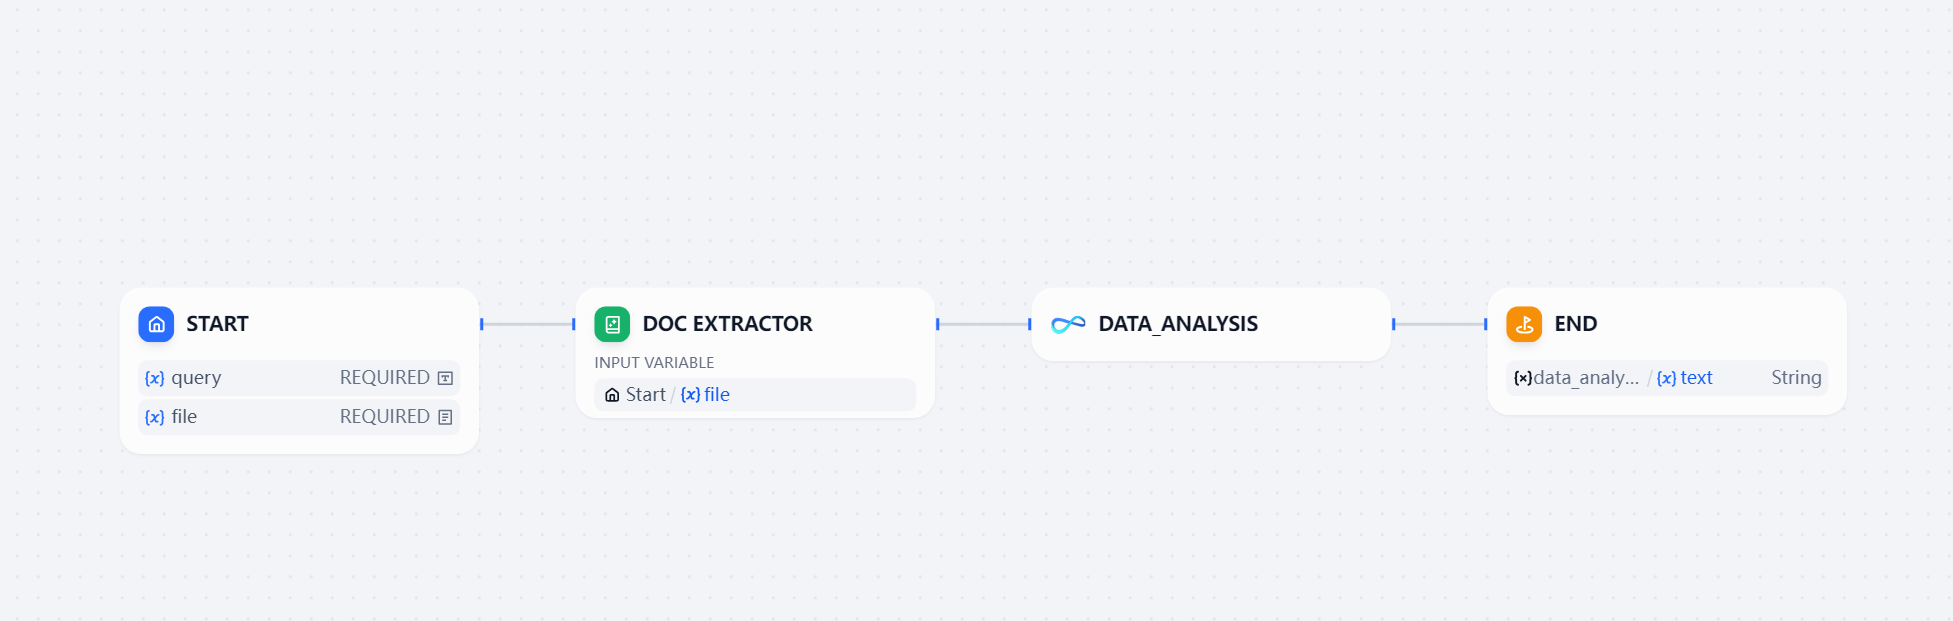
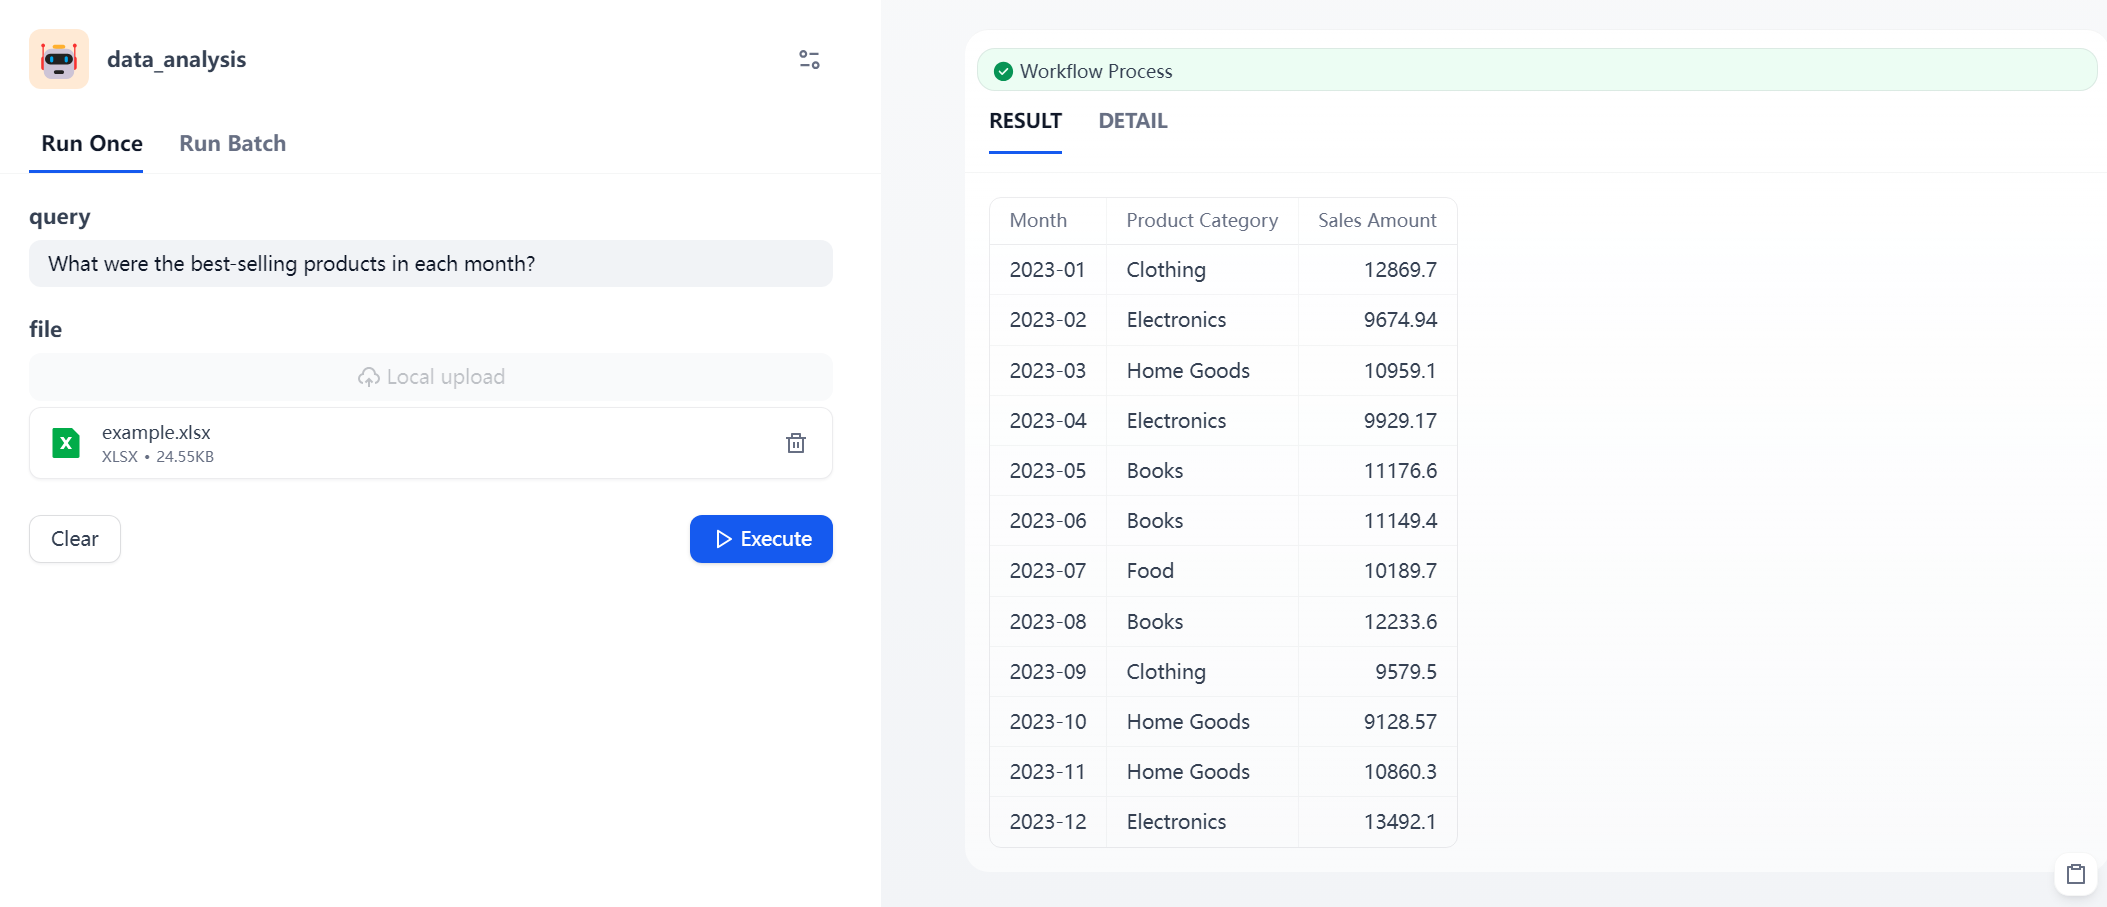
2. data_analysis
| Parameter | Description | Example |
|---|---|---|
| query | Query statement | "What were the best-selling products in each month?" |
| input_data | Table data in Markdown format (e.g. markdown text output by the Doc Extractor for tables) | As shown in the sales table example |
| file | Data file(xlsx、xls、csv) | example.xlsx |
| Note: Only one of input_data or file is needed. If both are provided, file takes precedence. |
The query results support downloading as an .docx file for easier local viewing and further processing.
查询结果支持下载为 .docx 文件,便于本地查看与二次处理。
💡 If you want the output to include files, please ensure to add the ' files ' output type in the last component of the flow to get the download link.
💡 如果想要输出结果包含文件,请确保在flow 的最后一个组件中添加“ files ”输出类型,以获取下载链接。
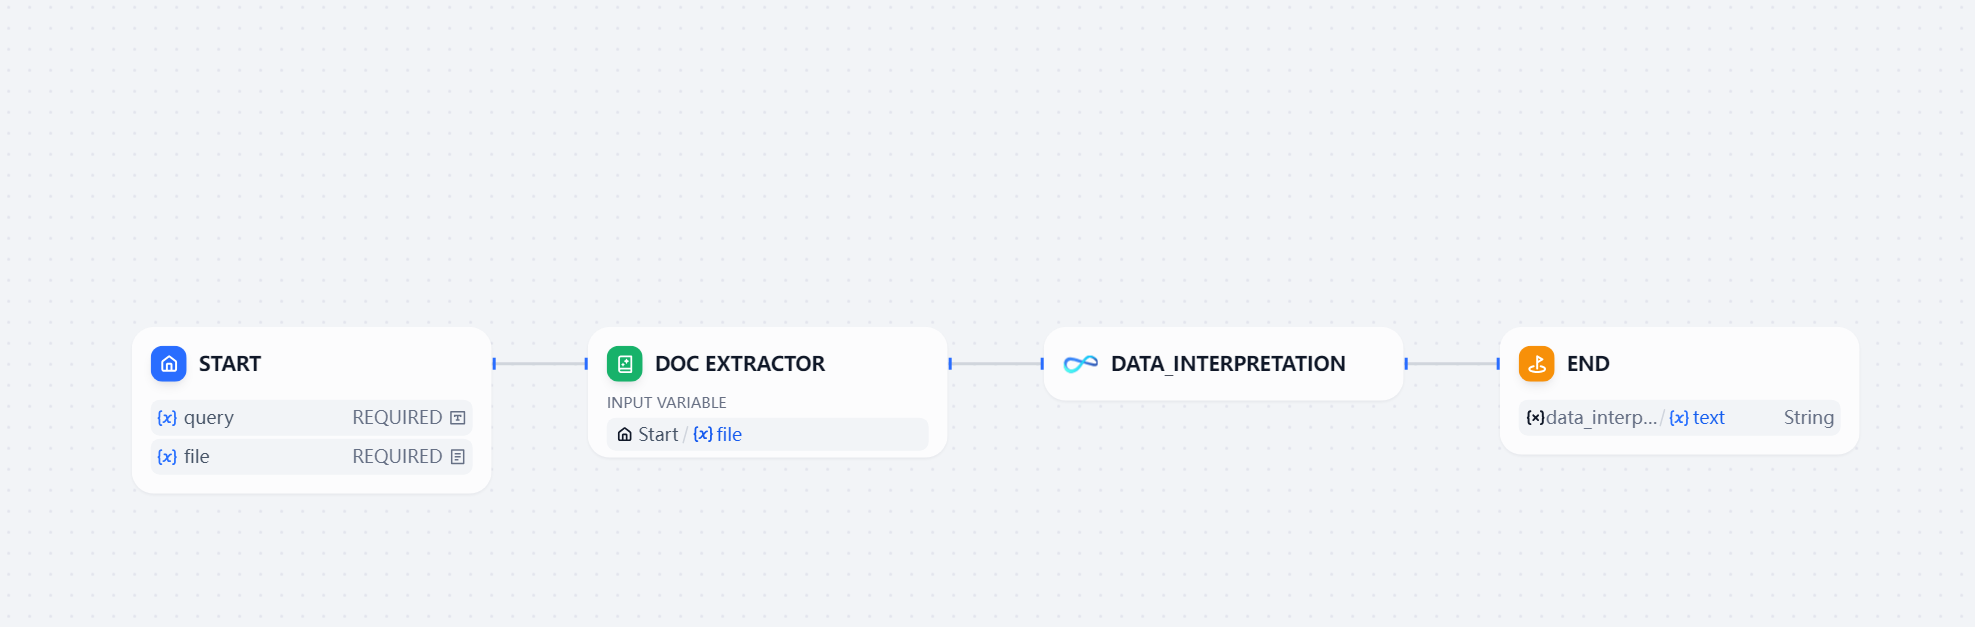
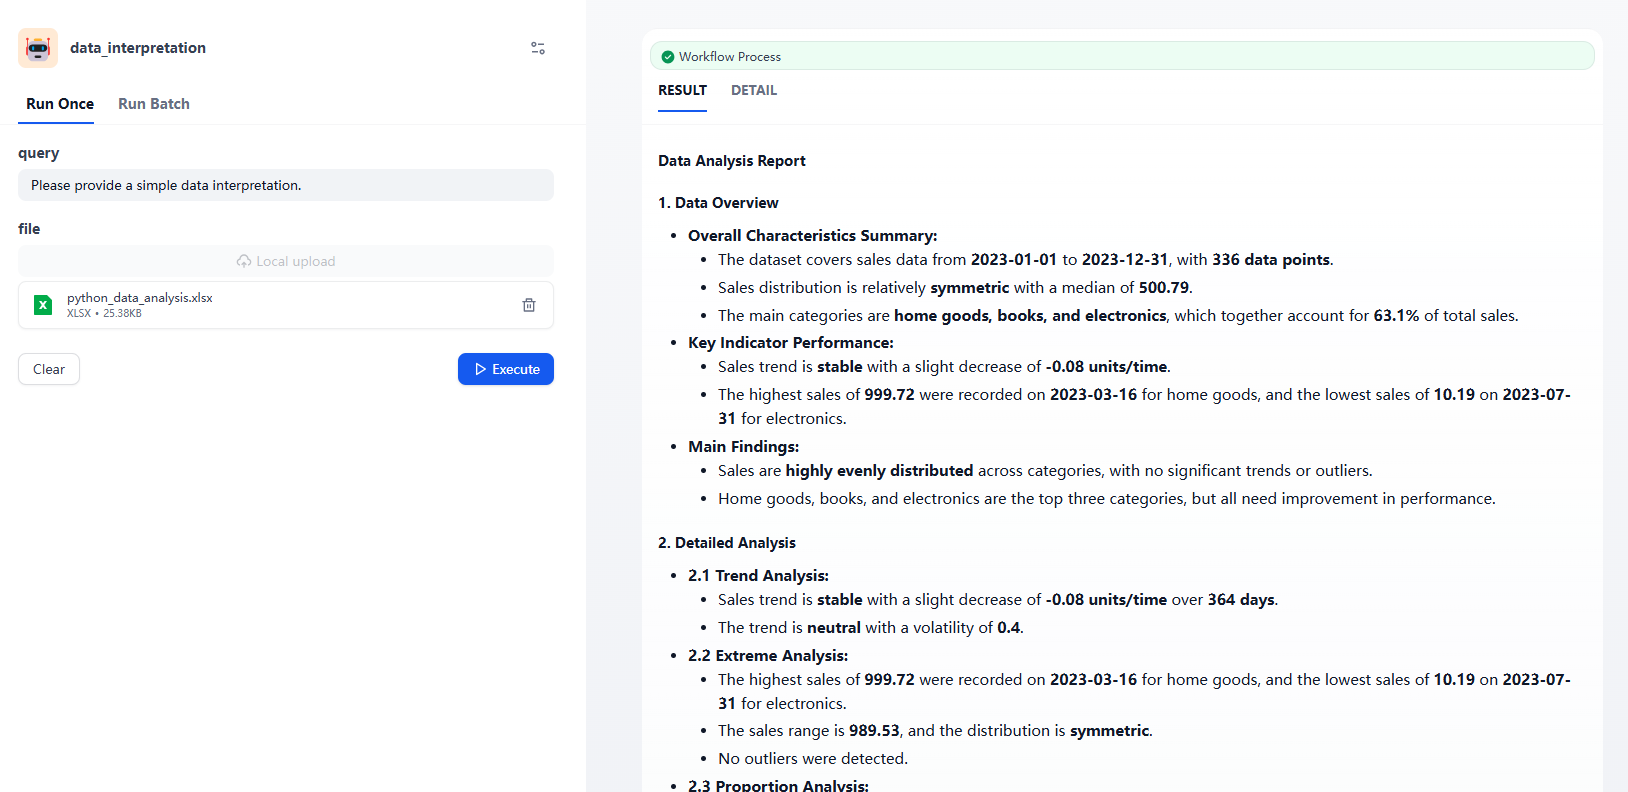
3. data_interpretation
| Parameter | Description | Example |
|---|---|---|
| query | Query statement | "Please provide a simple data interpretation." |
| input_data | Table data in Markdown format (e.g. markdown text output by the Doc Extractor for tables) | As shown in the sales table example |
| file | Data file(xlsx、xls、csv) | example.xlsx |
| Note: Only one of input_data or file is needed. If both are provided, file takes precedence. |
The query results support downloading as an .docx file for easier local viewing and further processing.
查询结果支持下载为 .docx 文件,便于本地查看与二次处理。
💡 If you want the output to include files, please ensure to add the ' files ' output type in the last component of the flow to get the download link.
💡 如果想要输出结果包含文件,请确保在flow 的最后一个组件中添加“ files ”输出类型,以获取下载链接。
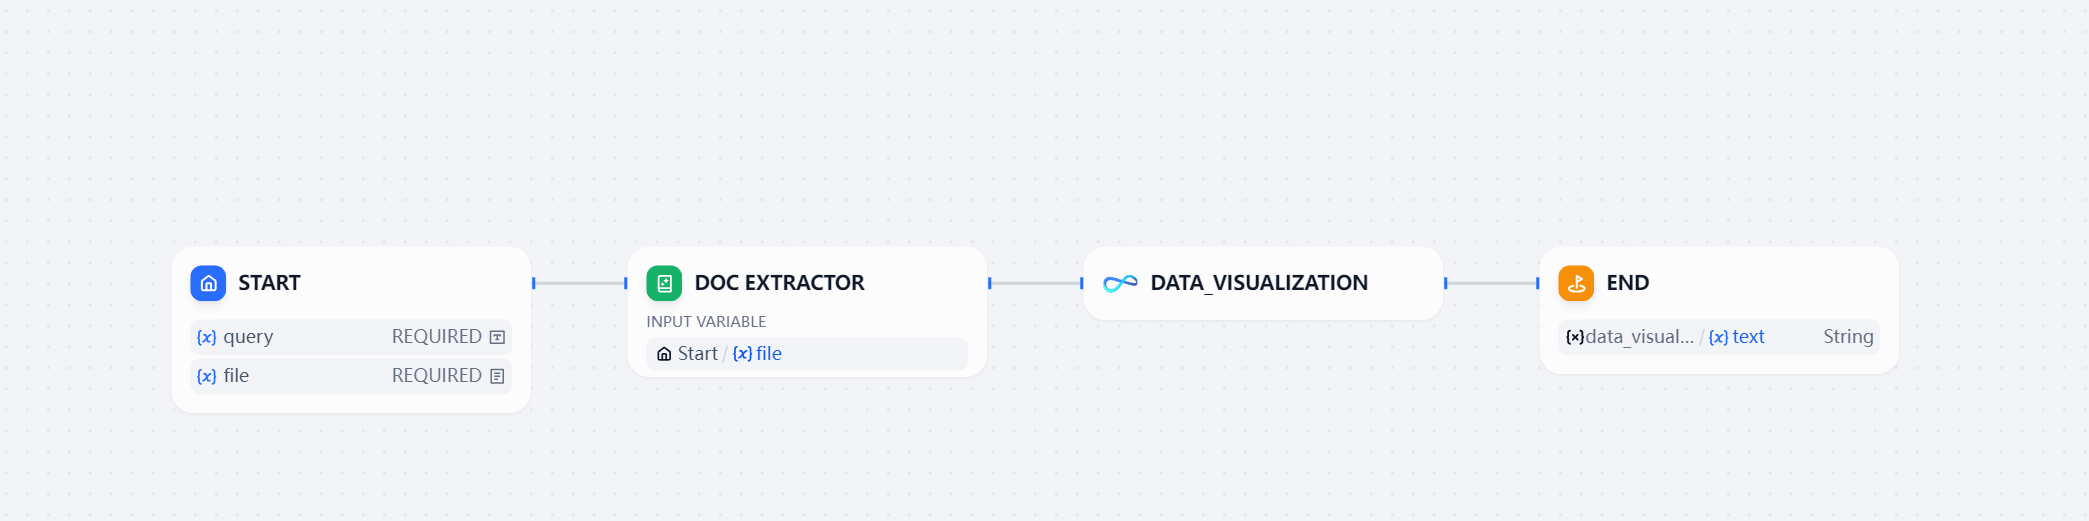
4. data_visualization
| Parameter | Description | Example |
|---|---|---|
| query | Query statement | "Display the total sales of each product in a pie chart." |
| input_data | Table data in Markdown format (e.g. markdown text output by the Doc Extractor for tables) | As shown in the sales table example |
| file | Data file(xlsx、xls、csv) | example.xlsx |
| Note: Only one of input_data or file is needed. If both are provided, file takes precedence. |
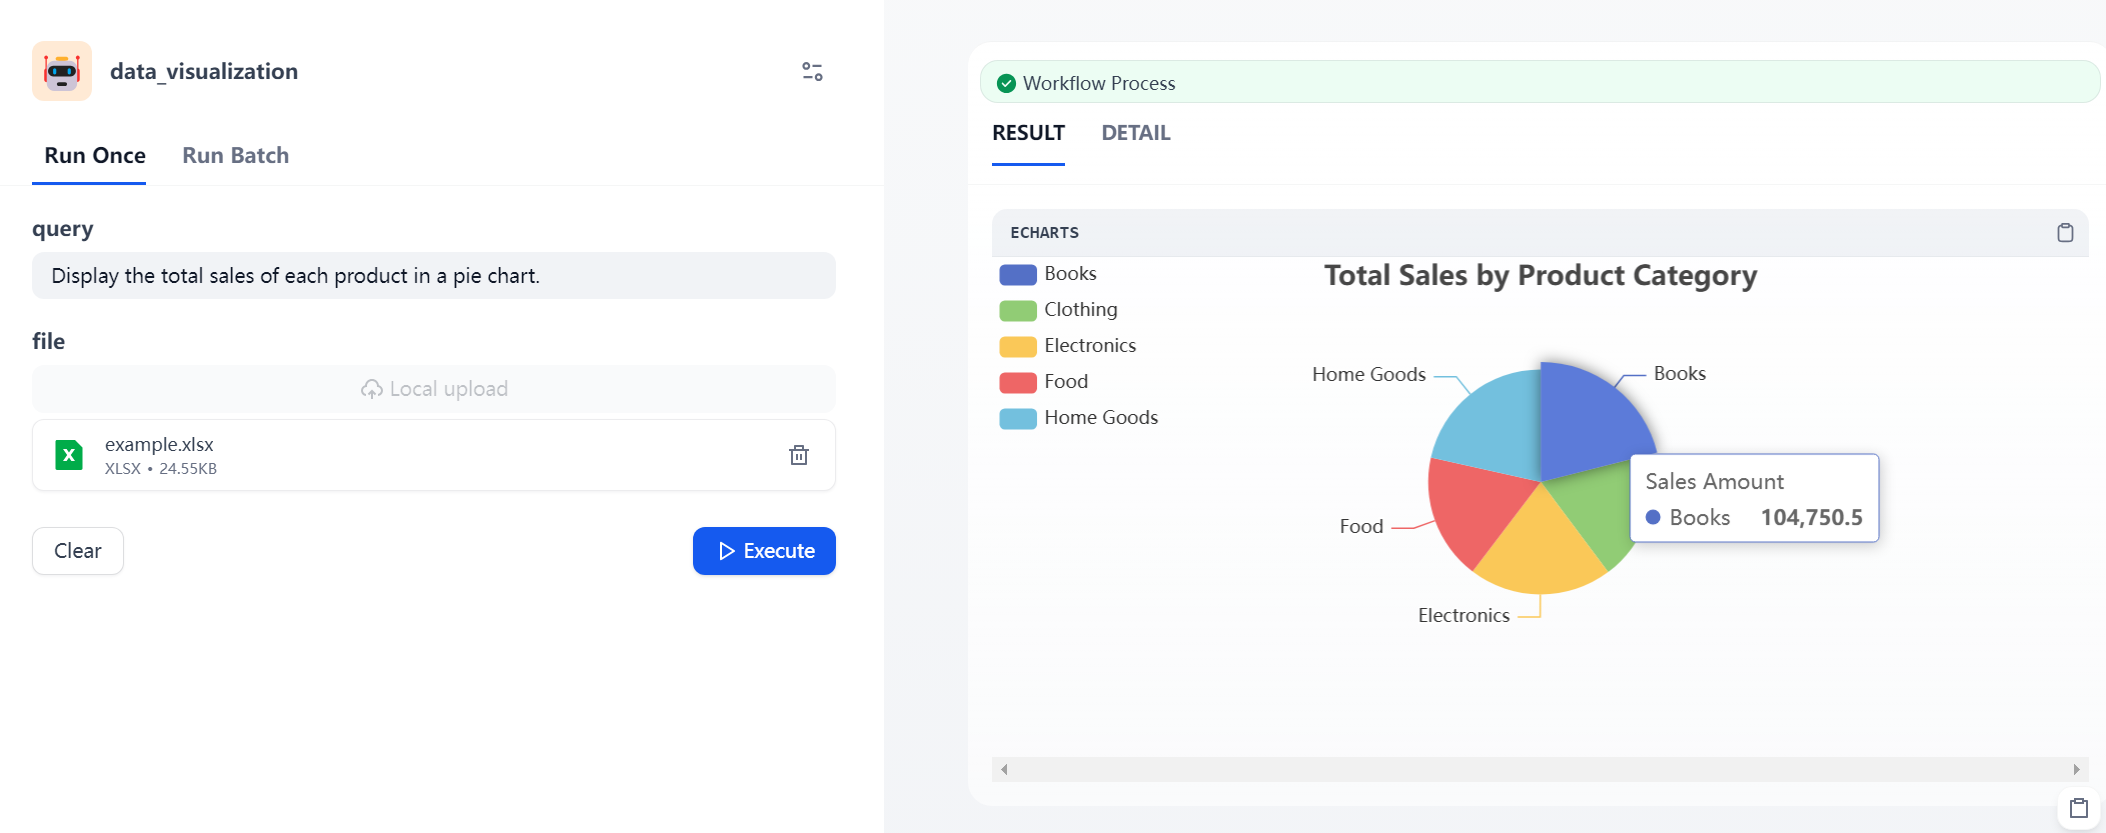
The query results support downloading as an .html file for easier local viewing and further processing.
查询结果支持下载为 .html 文件,便于本地查看与二次处理。
💡 If you want the output to include files, please ensure to add the ' files ' output type in the last component of the flow to get the download link.
💡 如果想要输出结果包含文件,请确保在flow 的最后一个组件中添加“ files ”输出类型,以获取下载链接。
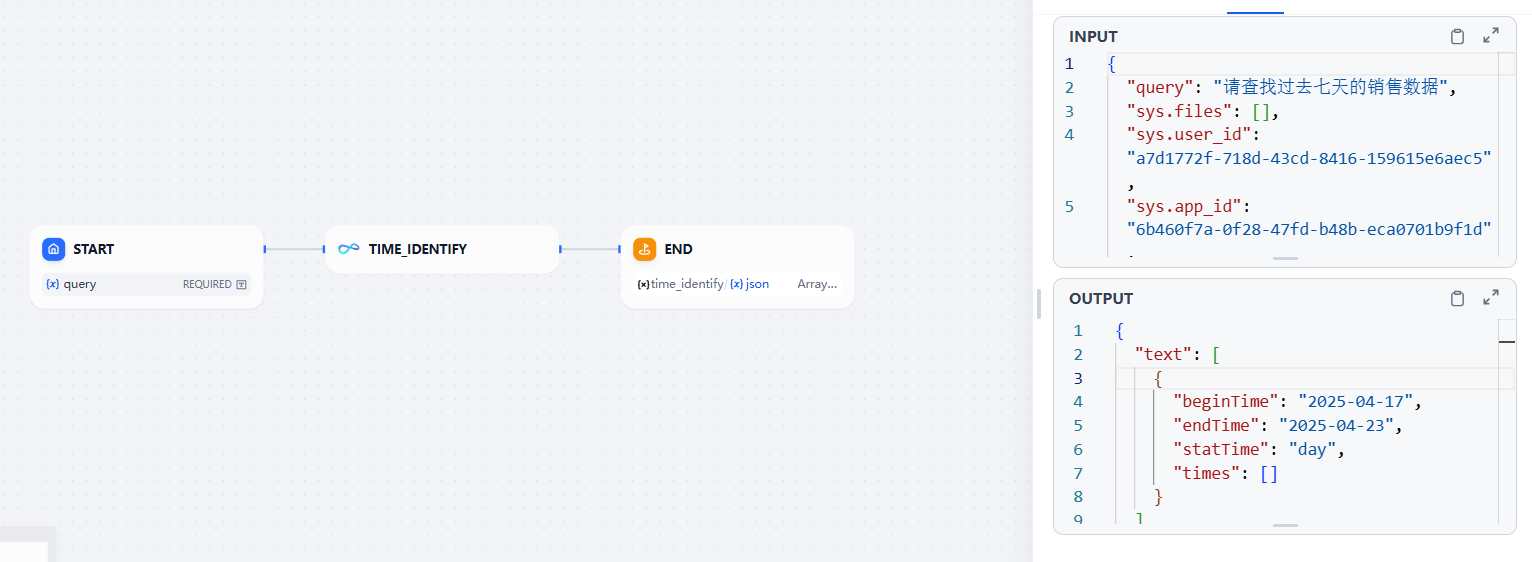
5. time_identify
Used to parse the time required for analysis based on the problem description
用于根据问题描述解析分析所需的时间
| Parameter | Description | Example |
|---|---|---|
| query | Query statement | "Show me the sales data from the last 7 days" |
| Output Parameters | Description |
|---|---|
| beginTime | Start time of the time range |
| endTime | End time of the time range |
| times | Discrete time points (e.g. Jan 1, 2025 and Jan 20, 2025) |
| statTime | Time granularity, including: "year", "quarter", "month", "week", "day". For example, if the user asks about "July of this year", the granularity would be "month". |
Note: Any time range excludes today and future dates. When the user asks about the last 7 days, the end time of the returned does not include today, and it is calculated backwards 7 days from yesterday.
注意:任何时间都不包含今天和未来,当用户问最近7天时,返回时间的结束时间不包含今天,从昨天倒推7天。
Consult
如果你有任何问题或建议,请联系我们
Contact us for inquiries or feedback.

欢迎了解我们的产品SwiftAgent,基于LLM和AI Agent的企业数据分析与决策产品。
Discover SwiftAgent: Enterprise-grade data analytics and decision-making powered by LLM and intelligent agents.